We approach work as a place to make the world better
We improve our customers' lives by making their businesses easier to run. We help make the world a better place because our customers are in the business of ensuring critical freight is delivered efficiently and on time.
4K
Users on the platform
We have successfully onboarded over 4,000 users. Maybe we're really good at training users -- or maybe the BrokerPro TMS is really easy to use. It's probably a bit of both.
$2.8 billion
We’re proud that our customers have made nearly $3 billion in total revenue.
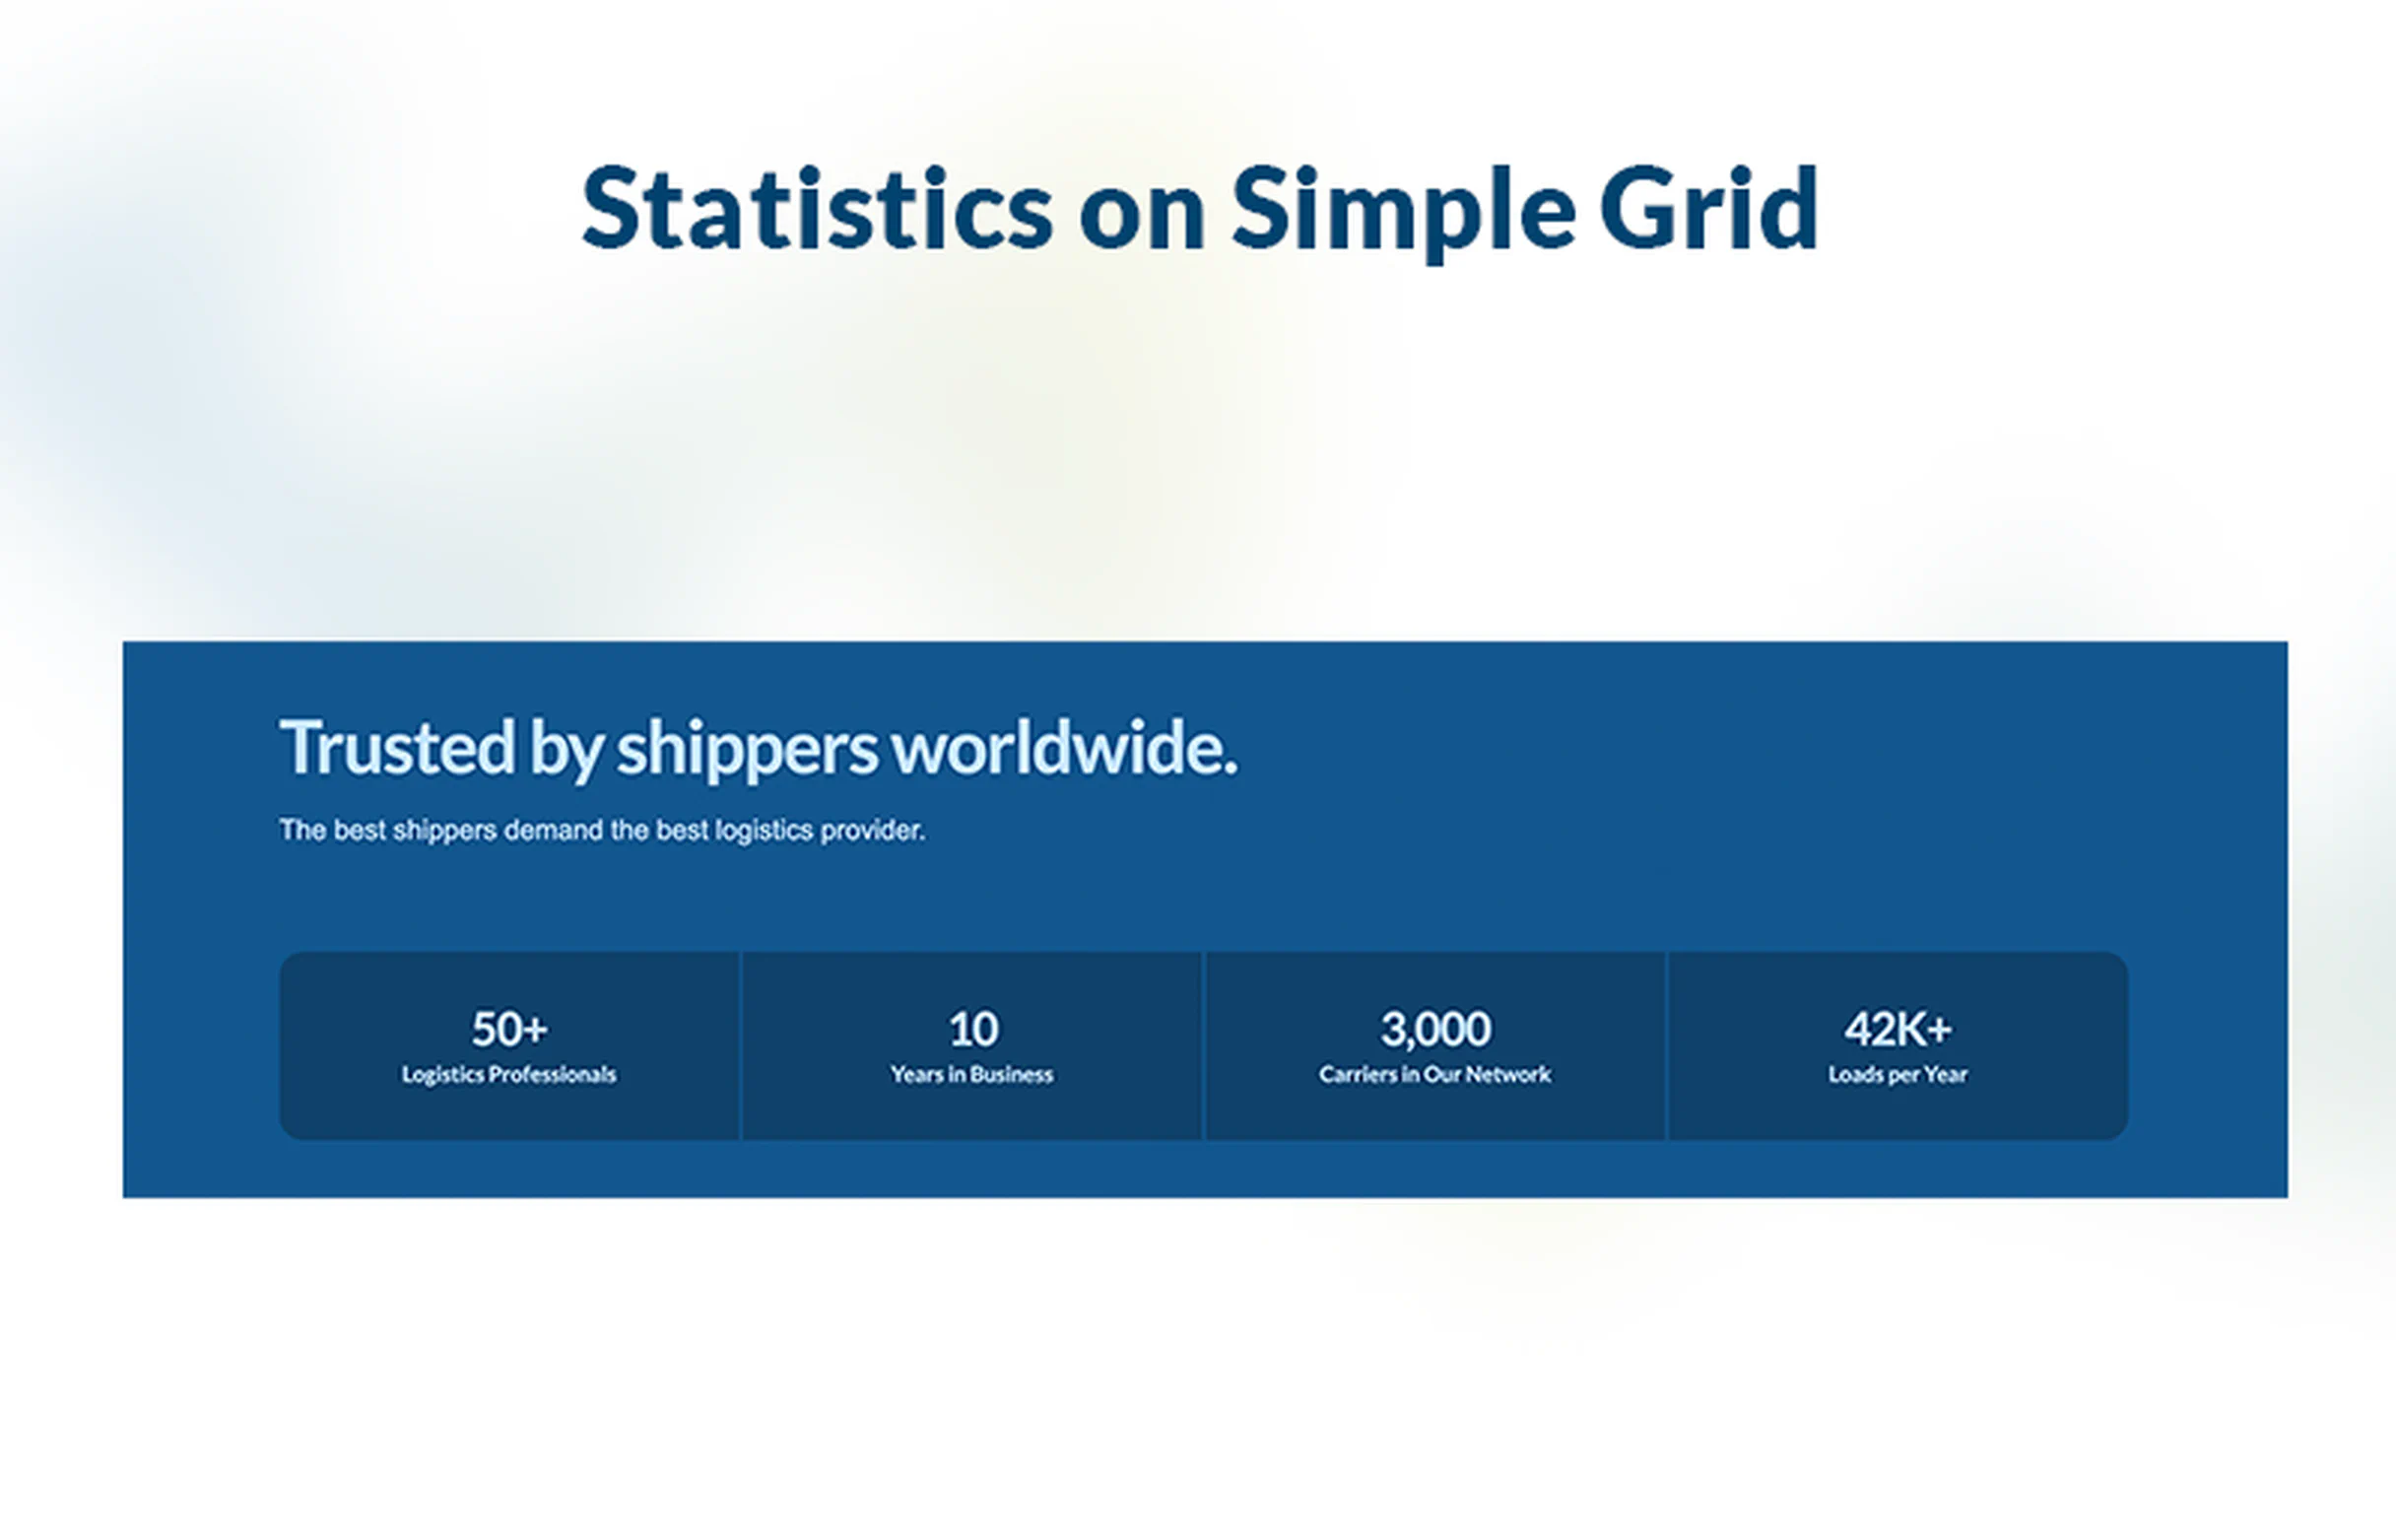
Our customers thrive -- even during freight market downturns.
34%
Increase in load volume
Most of our customers are really smart and would grow anyway, but BrokerPro has made it easier for them to grow faster while shedding operational overhead.
Highlight Key Metrics with Style and Clarity
Turn Your Numbers Into Trust-Building Social Proof
This BrokerOS Statistics in Scaled Container component provides a clean, stepped layout for displaying important statistics or performance figures. With distinct visual separation between each stat, this design helps you communicate meaningful metrics in a way that’s easy to scan and impactful.
Showing real data — such as revenue growth, number of clients, tons of freight handled, or years in business — gives your brand credibility. The stepped layout emphasizes the progression or scale of your achievements, building trust and making your success more tangible for visitors.
- Visual hierarchy through stepped design
- Each stat is clearly separated, making important numbers stand out and feel more trustworthy.
- Easy scanability
- Visitors can quickly digest key metrics without needing to read long paragraphs.
- Builds social proof
- Real, quantifiable metrics reinforce your credibility and reduce perceived risk.
- Responsive layout
- Tailwind ensures the stepped stats are flexible and display cleanly on mobile, tablet, and desktop.
- Trust-driven content
- Numbers backed by actual results (like customer count or growth) act as trust signals, improving your credibility in the eyes of prospects.
- SEO-friendly structure
- Semantic HTML + meaningful text around numbers helps search engines understand and index your value propositions more effectively.
Ideal for your website
This statistics component is especially ideal when:

- You have strong, meaningful metrics that demonstrate growth, traction, or impact.
- You want to highlight landing pages, homepage “About” or “Social Proof” sections, or “Why Us” areas to reinforce your reputation.
- You'd like to educate new visitors on your scale or milestone achievements in a structured way.
- You desire a visually clean, modular design that supports data without overwhelming your layout.
Best practices for using this statistics grid
Want more advice on how an impactful statistics grid can generate more business for you? Reach out to our sales team.
- Which metrics should I include in a stepped stats block?
-
Choose meaningful, high-impact numbers — things like total clients, annual revenue, number of shipments, or efficiency gains. Pick metrics that your audience cares about.
- How many statistics step should I display?
-
3–5 statistics usually work best. Enough to showcase variety or growth, but not so many that the layout becomes cluttered.
- Can I explain the stats with text?
-
Yes — include a short label or description for each number (e.g., “Active Customers,” “Tons Delivered,” “Countries Reached”) to provide context.
- Can the logos be clickable?
-
Yes — linking logos to case studies, testimonials, or partner pages adds extra value and provides a path for further exploration.
- How do I style the text for better readability?
-
BrokerOS Web handles most of this for you out by default. However, it's important to use large, bold fonts for the numbers, and smaller, lighter text for the labels.
- How will this affect page load speed / SEO?
-
Because it’s mostly text with minimal imagery, it's lightweight and very SEO-friendly. BrokerOS Web uses semantic markup (e.g.,
or - ) to help search engines interpret the data.
- Does showing stats like this actually help conversion?
-
Yes — presenting quantifiable proof of results builds trust. According to conversion-optimization and landing-page best practices, trusted metrics (“trust signals”) are key to reducing friction and increasing conversions.