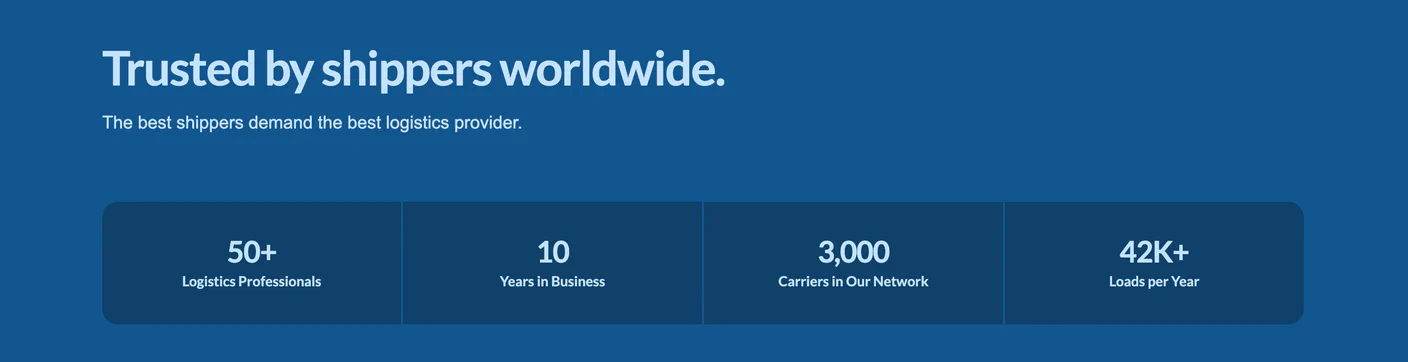
Trusted by shippers worldwide.
The best shippers demand the best logistics provider.
- Logistics Professionals
- 50+
- Years in Business
- 10
- Carriers in Our Network
- 3,000
- Loads per Year
- 42K+
Present Key Metrics Clearly with a Simple Grid
Communicate Real Impact Through Data
This BrokerOS Web Statistics component offers a clean, grid-based layout to highlight important statistics in a visually appealing yet straightforward way. With evenly spaced blocks for each stat, your numbers feel organized, digestible, and credible.
Numbers tell a powerful story. Using this stats grid, you can highlight meaningful metrics — like customer growth, freight volume, or annual transactions — to build trust, show traction, and validate your business’s strength. This kind of data-driven proof provides social validation and helps turn visitors into believers.
- Organized readability
- The grid format makes multiple stats easy to digest at a glance, without overwhelming the visitor.
- Trust-building through transparency
- Displaying real metrics provides authenticity and demonstrates that your business is open about its performance.
- Social proof by data
- Numbers act as a form of social proof — showing volume, scale, and growth can build confidence in your offering.
- Responsive and adaptable
- With Tailwind CSS, the grid adapts for mobile, tablet, and desktop, preserving clarity on any screen size.
- SEO-friendly structure
- Semantic markup with labels and numbers can help search engines understand your value proposition.
- Performance-conscious
- Because this component is primarily text-based, it’s lightweight and won’t significantly impact page load speed.
Ideal for your website
This statistics grid is especially ideal when:
- You have several meaningful metrics to showcase — not just one or two.
- Seek to reinforce credibility on homepage sections, “About Us” or “Why Choose Us” pages.
- You want a lightweight, non-invasive design — simple text, no heavy graphics, minimal load.
- Your goal is to build trust through transparency, showing real-world numbers that support your claims.
Best practices for using this statistics grid
Want more advice on how an impactful statistics grid can generate more business for you? Reach out to our sales team.
- What kind of metrics should I display?
-
Choose meaningful, credibility-building metrics: total clients, shipments executed, annual revenue, growth rate, or any KPI relevant to your business and audience.
- How many stats work best in the grid?
-
4 to 6 stats usually work well. This gives you variety without cluttering the layout or diluting the importance of each number.
- Should I include labels or descriptions for each number?
-
Yes — include a concise label (e.g., “Freight Tonnage,” “Active Brokers,” “Annual Shipments”) so visitors know what each number means.
- What text style should I use for the numbers?
-
Use bold or larger font for the numbers and a lighter or smaller font for the labels. BrokerOS Web's utility classes handle most of this for you to ensure your adheres to best practices.
- How do I make sure it’s mobile-friendly?
-
BrokerOS uses Tailwind’s grid or flex utilities with responsive breakpoints so the statistics reflow in a readable way on small screens.
- How does showing metrics help SEO and conversion?
-
Displaying real, transparent data builds trust, which can reduce friction and increase conversions. This kind of social proof also signals quality and legitimacy to search engines.

